
Find More Fish With Navionics Depth Range Filtering
A hidden setting in the Omnia app's Navionics map layer lets you highlight any depth range on the lake — turning the contours into a targeting tool that changes with the seasons.
Most anglers use a lake map the same way they always have: scan for the obvious stuff, find the deep hole, locate the points and flats, and go fishing. It's a reasonable approach — but it leaves a lot on the table.
The Navionics HD depth charts in the Omnia app include a feature called Fishing Mode, and buried inside it are two sliders that can completely change how you read a lake. By setting a minimum and maximum depth range, you tell the map to turn everything within that range white — while everything outside it stays in the standard blue-gray. The result is a surgical visual tool that lets you isolate exactly the depth zone you want to target on any given day.
As summer sets in and fish follow the thermocline deeper, that kind of precision matters more than ever. Here's how to use it.
Where to find it: On any lake map in the Omnia app, tap Maps in the left sidebar, then select Navionics HD Depth Charts. Once the Navionics layer is active, open the Navionics Settings panel (look for the settings icon or scroll to the bottom of the layer options). Toggle Fishing Mode on, and the Fishing Area Min and Max sliders will appear.
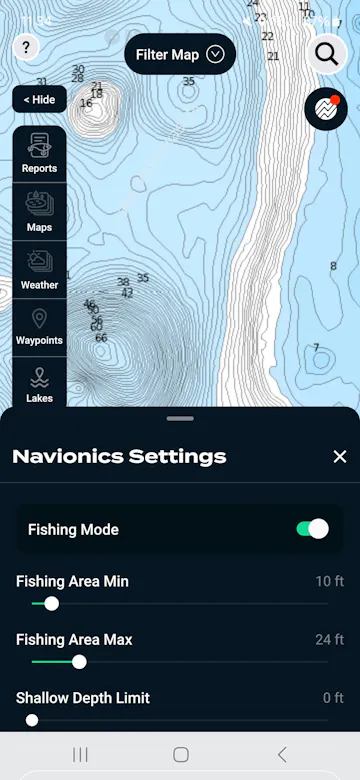
The Navionics Settings panel. Toggle Fishing Mode on, then use the Min and Max sliders to define your target depth range. Everything in that range turns white on the map.
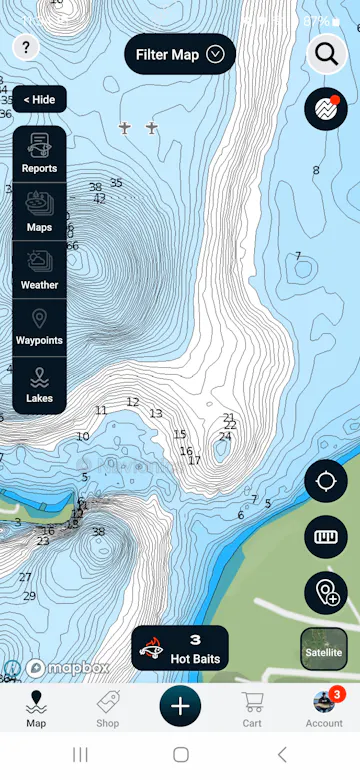
With Fishing Mode active, everything in your selected depth range becomes white, making it easy to spot structure at a glance within your target zone.
Why This Changes How You Read a Lake
Standard lake maps are visually busy. Contour lines run edge to edge, depth numbers stack on top of each other, and structure that should be obvious gets buried in the noise. Your eye has to do a lot of work to extract the information that actually matters for where you're fishing.
The depth range filter strips that noise away. When only one depth band is highlighted, the lake suddenly has visual hierarchy. Structure jumps out. The absence of color becomes as meaningful as the presence of it — you can see at a glance where a hump crests, where a weedline ends, where a breakline runs. It's the difference between reading a map and seeing it.
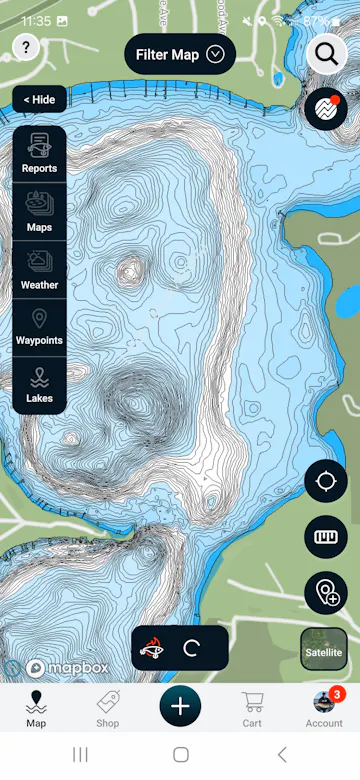
The filter makes deep basin areas immediately obvious by keeping them white, while shallower structure shows its true shape in blue.
Example 1: Finding Deep Humps in Summer
Mid-lake humps are some of the most productive summer structure on Minnesota and Wisconsin lakes — and they're also some of the easiest to miss. On a fully rendered contour map, a hump that tops out at 16 feet looks like just another set of circles in a lake full of them. When you're scanning for something specific, it blends in.
The depth range filter solves this. Set the minimum to 23 feet and push the maximum out to 109 feet, and you're telling the map to highlight everything deeper than 23 feet. Any hump that crests shallower than that minimum will stay in blue — and those humps become unmistakable against the white basin around them.
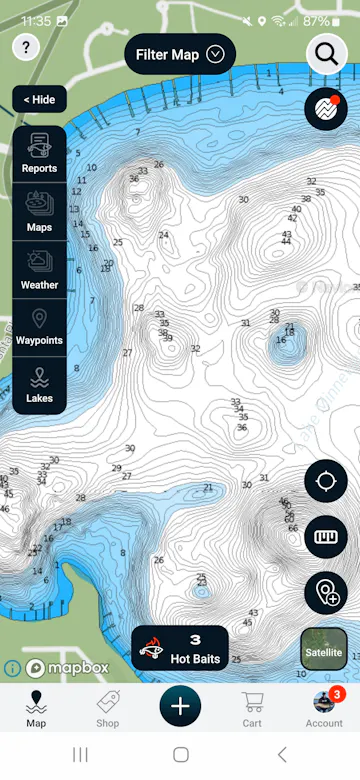
Settings dialed to 23ft min / 109ft max. The hump in the center of the lake — topping out at 16 feet — stays blue while the surrounding deeper water goes white, making it immediately visible.
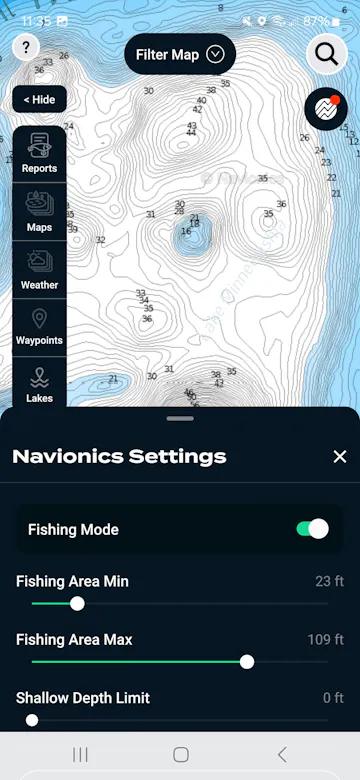
With the filter active, mid-lake humps that crest above your minimum depth threshold become obvious — a visual shortcut that would take minutes to find by reading raw contours.
Why Summer Humps Hold Fish
As water temperatures climb through June and into July, most species follow the thermocline — the layer where warm surface water meets cooler water below. In many Minnesota and Wisconsin lakes, that stratification settles somewhere between 15 and 25 feet depending on the lake's depth and clarity. Structure that sits right in or near that zone becomes a magnet.
Humps matter because they concentrate bait. The hard bottom, current breaks created by the structure, and proximity to deep water all draw forage — and where the bait is, the predators follow. For largemouth and smallmouth bass, mid-lake humps with irregular edges and scattered rocks or wood can hold fish all summer. For walleye, rock humps near the thermocline can be especially productive during low-light windows when fish slide up to feed.
The other thing humps do is give fish options. On a flat bottom lake, there's nowhere to go when conditions shift. A hump with a top at 16 feet and a base at 30 feet lets fish adjust vertically without moving far. That consistency makes them worth returning to throughout the season.
PRO TIP:
Once you find a hump using the depth filter, zoom in and look at its shape. A hump with one steep side and one gradual slope is usually better than a symmetrical one — the gradual side gives baitfish a travel route up and down, and predators set up at the transition. The steep side is often where you find the biggest fish sitting tightest to structure.
Example 2: Targeting Deep Weedlines With C-MAP Vegetation Data
Not every summer bite is about hard structure. On clearer lakes, vegetation grows surprisingly deep — and the weedline that exists at 12, 14, or 16 feet can be just as productive as any rock hump. The challenge is finding exactly where that edge is, and which parts of it are actually worth fishing.
This is where the Omnia app's combination of the Navionics depth filter and the C-MAP Social Vegetation layer becomes genuinely powerful. Together, they let you pinpoint the depth of the deep weedline and then see exactly where vegetation has been mapped at that depth across the entire lake.
Start With The Fish Patterns Data
Before dialing in any settings, check what the lake's own data is telling you. The Fish Patterns section in Omnia aggregates reports and historical data to surface where specific species are being caught and in what conditions. On Lake Minnewashta in Minnesota, for example, the summer largemouth bass pattern shows fish sitting on deep weedlines at 14 to 15 feet — particularly where scattered clumps create ambush points rather than a clean continuous edge.
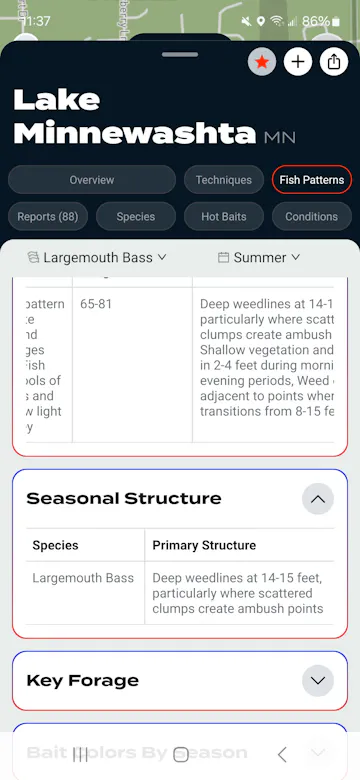
The Fish Patterns tab on Lake Minnewashta shows largemouth bass holding on deep weedlines at 14-15 feet in summer — exactly the kind of specific intel that tells you what depth range to target.
That specific depth reference — 14 to 15 feet — becomes your starting point for the filter. Instead of scanning the whole lake, you now know exactly what you're looking for.
Dial In a Tight Depth Band
With a target depth in hand, set the Navionics Fishing Mode sliders to a narrow range that brackets that zone. A min of 14 feet and a max of 17 feet creates a thin band of white on the map that traces the contour at exactly that depth. Every other depth stays blue.
What you're left with is a precise visual marker that runs around the lake along the deep edge — the outer boundary of where vegetation is likely to exist. It's a narrow ribbon of white against blue, and it shows you the shape of that edge in a way that's almost impossible to read from standard contour lines alone.
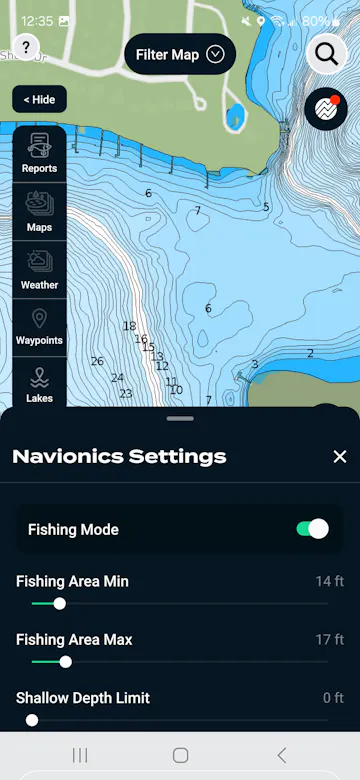
Tightening the range to 14-17ft creates a narrow white band that traces the deep edge of the target zone. The thinner the band, the more precisely you're defining your search area.
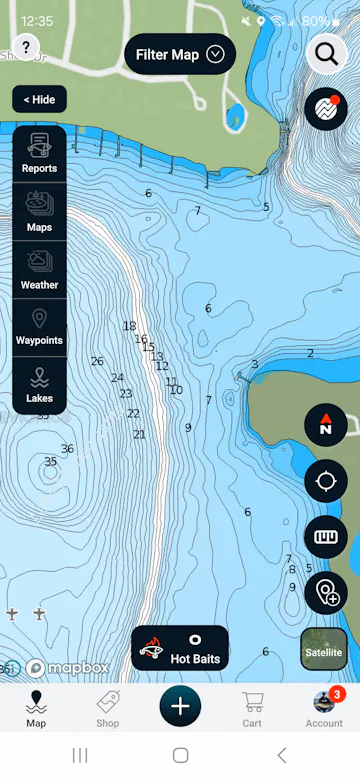
Tightening the range to 14-17ft creates a narrow white band that traces the deep edge of the target zone. The thinner the band, the more precisely you're defining your search area.
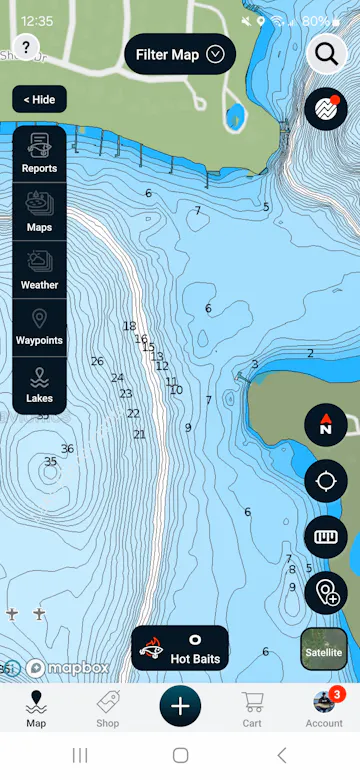
The resulting thin white band runs along the break at 14-17 feet. On this section of shoreline you can see the depth numbers stacking up quickly — a steep break that concentrates fish along a specific contour.
Layer On The C-MAP Vegetation Data
The depth filter tells you where the bottom is at your target depth. But it doesn't tell you where the weeds actually are. That's where the C-MAP Social Vegetation layer comes in.
To enable it, tap Maps in the sidebar, then scroll down to the C-MAP section and toggle on C-MAP Social Vegetation. This layer uses crowd-sourced sonar data to show where vegetation has been recorded across the lake bottom — and it maps it with enough resolution to show the outer edge of growth.
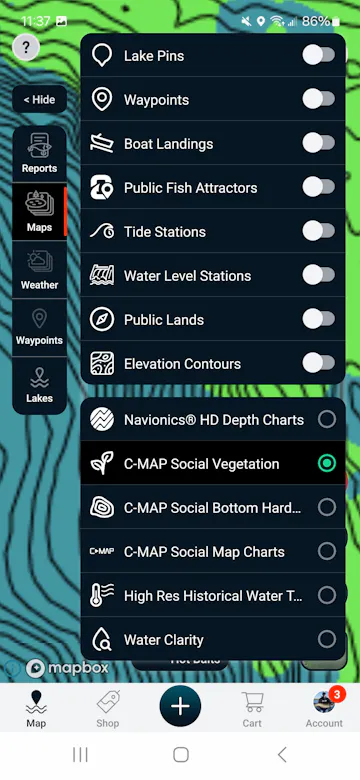
In the Maps layer menu, scroll past the standard toggles to find the C-MAP data layers. C-MAP Social Vegetation (shown selected in green) overlays crowd-sourced plant growth data on the depth chart.
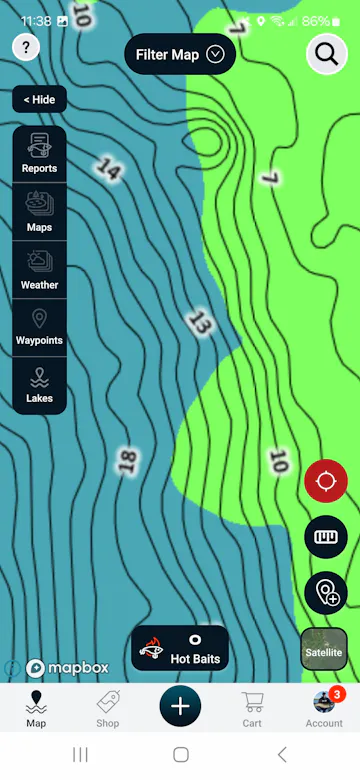
The C-MAP Social Vegetation layer overlaid on the map. The bright green shows where vegetation has been recorded. Notice how the weed edge follows specific depth contours — that's your fishing highway.
With both layers active simultaneously, you can see the outer edge of the vegetation and your target depth band in the same view. Where the two align — where the green vegetation overlay reaches out to your white depth band — that's the deep weedline. Not a guess at where it might be, but a data-informed location of where it actually exists on this lake.
On a lake like Minnewashta where the bass pattern specifically calls out scattered clumps as ambush points rather than solid edge, you're also looking for irregularities: places where the vegetation pushes out a little deeper, points where clumps extend beyond the main edge, inside turns where grass concentrates. Those details are visible in the vegetation layer, and the narrow depth band confirms which ones are at the right depth to fish.
Why Clear Lakes Have Deeper Weeds
The depth of vegetation growth on any given lake is directly tied to water clarity. Aquatic plants need sunlight to grow, and sunlight penetration is limited by how much particulate matter, algae, and tannins are suspended in the water column. On a stained or turbid lake, vegetation rarely grows beyond 6 or 8 feet because light doesn't reach the bottom below that. On a clear lake like Minnewashta, where sunlight penetrates 12, 15, or even 18 feet, plants can establish along much deeper contours. This means the deep weedline on a clear lake is a fundamentally different feature from the deep weedline on a stained lake — it's both deeper and often more defined, because the transition from "enough light for growth" to "not enough light" happens over a shorter vertical distance as you go deeper and light diminishes. When C-MAP vegetation data shows weeds pushing to 14 or 15 feet, that's a direct indicator that you're fishing a high-clarity lake — and clarity also affects how fish use that structure. In clearer water, fish can see farther and tend to hold tighter to specific cover rather than roaming broadly.
How To Fish It Once You've Found It
A confirmed deep weedline at a known depth gives you something to work with systematically. Run the edge with your trolling motor set to hold the contour, keeping your transducer reading close to your target depth. When you mark fish or bait, note what the vegetation looks like in that specific spot — whether you're on a clean edge, a point where the weeds push out, or a gap in the growth.
For largemouth bass on deep summer weedlines, presentations that stay in the zone are more effective than anything that has to be retrieved through the water column. A Texas-rigged creature bait or a weedless swimbait worked along the deep edge, occasionally bumping into the tops of the vegetation, is a classic pattern. Slow down on the spots that show the most irregular weed shape — those are the ambush points the Fish Patterns data is pointing you toward.
Combine Both Tools
The real power here is using the Fish Patterns depth reference to set your filter before you ever get on the water. Pull up the lake, check the summer largemouth or walleye pattern for a specific depth, dial in that range on the Navionics slider, and overlay the C-MAP vegetation layer. You can pre-identify every section of deep weedline worth investigating before you launch the boat — and spend your time on the water fishing instead of searching.
Making It Part of Your Pre-Trip Routine
The depth range filter isn't a one-size-fits-all setting — it's a tool you adjust based on what you're looking for that day. Early in the season when fish are shallow, a tight band at 8-12 feet might highlight the inside edge of the weedline where bass are spawning or recovering. In peak summer, bump the minimum out to 20 or 25 feet and scan for deep basin structure. In fall, a narrow band at 10-15 feet might trace the contour where walleye are staging before the late-season push.
The combination with Omnia's Fish Patterns data is what makes this genuinely useful rather than just a visual trick. When the pattern data tells you a specific depth, the filter makes that depth visible. The lake stops looking like an undifferentiated bowl and starts showing you where to start.
- 1. Open the lake in the Omnia app and tap Fish Patterns to find the current species-specific depth range.
- 2. Switch to the Maps tab and enable the Navionics HD Depth Charts layer.
- 3. Open Navionics Settings, toggle Fishing Mode on, and set the Min and Max sliders to bracket your target depth.
- 4. Scan the lake for structure that shows up clearly — humps staying in blue below your minimum, or the white band tracing your target contour.
- 5. If vegetation is a factor, toggle on C-MAP Social Vegetation to see where plant growth intersects your target depth.
- 6. Mark the spots worth investigating and head to the water with a plan.
Good maps are only as useful as the questions you bring to them. The depth range filter gives you a way to ask a very specific question — "where on this lake does the bottom sit between 14 and 17 feet?" — and get an immediate visual answer. Combined with what Omnia's pattern data tells you about where fish should be, that's a significant head start.